
I seem to be making a lot of displays lately. Here’s another one.
Design Concept
I’ve had this planned for a while. The concept is to display the frequency of the UK mains electricity supply. This is meant to be 50Hz, but the frequency actually fluctuates around this value, as a result of changes to supply and demand.
If the frequency drops, it’s because demand has risen and/or supply has dropped, so generators have to work harder. This slows then down a bit, and the control systems take time to speed them back up.
If the frequency rises, it’s because demand has falled and/or extra supply has come on, so generators have to work less. This increases their speed a bit, and the control systems take time to slow them down.
So the frequency is constantly rising and falling. You can see a real-time graph of the last 60 minutes on the national grid website, and a nice real-time analog-style meter at the Dynamic Demand website.
I wanted to make a display that could show the mains frequency to 3 decimal places. I’d be using the same seven-segment display modules that I used in my UNIX clock, so all I had to do was design the part that would work out the frequency.
How to work out the frequency
There are lots of techniques to do this. My choice was to count a fixed number of mains frequency periods and time how long that takes to occur.
Here’s a drawing of the concept: The sine waves represent the mains. A high-frequency signal is run in parallel and used as a counter. The count after a fixed number of cycles is inversely proportional to frequency.

The concept of measuring a varying low-frequency signal.
For example, if the frequency was exactly 50.000Hz, and I counted 200 periods, that would take exactly 4 seconds. If the frequency was actually 50.001Hz, 200 periods would only take 3.99992 seconds.
That’s not a lot of difference! In order to time that accurately, I need a high-accuracy, high-stability timing source. The RC oscillator in the microcontroller wouldn’t do. I would be using an ATTINY84, which has an accuracy of only +/- 10%, or +/- 1% after user calibration. Nor could I use an external crystal, without paying a LOT of money for a high-stability one.
Luckily, there is one class of cheap(ish) ICs that have high-accuracy, high-stability oscillators in them, and that’s real-time clocks. The DS3231 RTC chip, which was also used in the UNIX clock, has a +/- 2ppm 32.768kHz output. By counting pulses from this, I can determine the time very precisely.
Maths!
After doing some maths, I figured that I could count for 100 mains cycles (2 seconds at 50Hz) and get my required accuracy.
The formula to translate count to mains frequency is
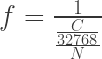
where N is the number of mains cycles counted and C is the number of 32768 Hz cycles counted.
I re-arranged this, and added a 1000x multiplier in order to only use integer maths, so 50.000Hz would actually be stored as 50000. This is much nicer for implementing on a microcontroller.

Because we’re doing integer maths, we need to account for rounding, so the final formula is
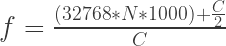
For example, a count of 65724 would equate to a frequency of 49.857Hz, stored as 49857. A count of 65723 would equate to a frequency of 49.858Hz, stored as 49858.
So, a change of one count represents a change of one significant figure (of the scaled frequency), exactly what I want.
The frequency value is sent directly to the display, so the frequency shown is updated every two seconds.
There are two LEDs on the control PCB to display the up/down trend of the frequency. The frequency is stored in a ring buffer once a minute. A ten-minute rolling average is calculated, and the difference between the first and last readings is used to work out the trend. A difference of more than +/- 0.02hz is counted as a significant trend.
In order to find the “best” algorithm for this, data from the National Grid real-time display was parsed with the Beautiful Soup python module. I just experimented with various guesses until it looked about right.
Putting it all together
I tested the code on an Arduino with an opto-isolated mains input before designing the final circuit. The electronic design draws on a lot of previous work I’ve done. It has:
- The mains-frequency input from my Days-Accident-Free counter.
- (This clamps a 9V AC signal (from a small wall-wart transformer) to the 5V supply rails)
- The display connection and DS3231 RTC from the UNIX clock.
- A standard ATTINY84 microcontroller from a host of other projects.

The system block diagram
I was able to reduce the board size down to be the same size as a seven-segment display, which was nice. I ordered the boards from Ragworm, and everything worked first time, which was nice.
The only modification I made was to add a small “heatsink” to the 5V regulator. The input to the system is 9V AC from a small adaptor. Because the regualtor runs all 5 displays, it’s dumping about 1W of power into a rather small package. It gets pretty hot, so I added a heatsink made of lots of solder on a bit of stripboard. A bit of a hack, but it does help keep the regulator cooler than it would be.

The control PCB, with LEDs, microcontroller, power supply and “heatsink”.
Finally, I made a laser-cut case (as is practically standard for my projects). It was an adaption of the UNIX clock casing. For the up and down trend LED symbols, I tried using crayon wax melted into two laser-etched arrows. This worked pretty well, so I think I might use this technique on future projects.

The completed display, showing a “down” frequency trend.

The frequency trend of interest
EDIT: As someone asked, the schematic for the display mains board

Great project. A few questions:
On your graph, what’s the horizontal scale ?
When I was a boy, I read that over a 24-hour period they’d try to make sure that the average mains frequency was very close to 50Hz. Can you verify that ?
Being paranoid, I might also try logging the temperature in your lab just to rule out any significant temperature dependence in your crystal oscillator.
M.
Hi,
The graph is from the UK’s National Grid website. It shows an hour of frequency data.
As far as I know, the frequency is corrected to 50Hz as a long term average. With the current software on the build, I can’t verify the long-term frequency average though. A few other people have asked this, so maybe it’s something I’ll look at doing.
As for temperature, I’m using a Maxim DS3231 RTC, which (according to the datasheet) has an as accuracy of +/- 2ppm over the 0-40° C range.
Finally, it would be very nice to have a lab! But it’s just me, our house’s spare bedroom, and the Hackspace.
Thanks for the comments and questions, it’s appreciated!
Pingback: Mains Frequency Display
Pingback: Belgaum news | About Belgaum | Belgaum information | Belgaum district | Belgaum city | Belgaum Hotels | Belgaum People | Belgaum tourism | Belgaum entertainment | Belgaum students | Inside facebook | Hack | make use of | technical news | | Mains Frequency
Where in the country is your sensor located? I am about 20 miles North of Manchester and the frequency here tracks the frequency on the Grid real time display but it either leads or lags it by up to 2 or 3 seconds, sometimes they match and sometimes they don’t. I suppose this is related to where the generation is and where the loads are. I don’t use any accurate oscillator to measure, I just take a reading and compare it to the 24 hour average which I know to be 50 Hz always. Interesting to note that a 24 hour average is not really needed, anything over 4 hours is close enough for 3 decimal places. http://81.110.238.61 shows my sensors (if any are turned on), frequency is not plotted, though it is displayed, as it’s not really of interest for what I am doing other than alarm if it goes out of range. I only measure it as it is used to calculate voltage, current and phase.
Hi John,
I’m in Nottingham. From my house (well, from the entire city) I can see the steam plumes from the cooling towers at Ratcliffe-on-Soar (weather permitting).
To my knowledge, the frequency is the same over the entire grid, and there isn’t any significant propagation delay when generation and loads come on/off. I have a friend who’s a network engineer at E.ON, maybe I should ask him for the details.
If that’s true, then any inaccuracies must come from measurement. I can understand a lead/lag of a few seconds, I suspect that the NG website’s little graph isn’t high on their list of priorities for accurate data reporting.
I’m interested in the sensors generating your data, is there a page that describes them in more detail?
I had a few emails with the guy that made the Grid sensor but he hasn’t told me anything significant so I don’t know how the delay may be from his end. There is no webpage about my sensor but there are some pictures and stuff though I don’t really want to put them on here, if you can get me an email address I will send you the link
possible typo: http://s0.wp.com/latex.php?latex=f+%3D+%5Cfrac%7B32786+%2A+N+%2A+1000%7D%7BC%7D&bg=ffffff&fg=333333&s=3
shouldn’t that (and the next) read 32768
Yes, they should! Well spotted!
In Australia…
The goal is to average 50HZ over the day so that synchronous clocks running on mains frequency remain correct.
To do this the frequency can be maintained above / below 50Hz on purpose by the Grid control system.
BTW.. There will be defined limits which it must be kept within.
Hope this helps…
sir will you give me the hex code and circuit? and main c code to my farukmw@yahoo.com for main frequency meter??. please sir
Hello Faruk,
All the code is here: https://github.com/jamesfowkes/fMainsDisplay
It uses my AVR code library, here: https://github.com/jamesfowkes/Code-Library/tree/master/AVR
I’ve updated the post to include a PDF of the schematic.
Hope that helps,
James
Hi,
compliments for the original and ingenious solution !
I need to use this circuit to measure (and display) the number of revolutions of a turntable motor that, as known, rotates at a rated speed of 33 1/3 RPM.
The IR sensor (with marker disc mounted to the motor) detect 54 pulses on each revolution, so the frequency is 30 Hz.
I would like to accurately measurement and display RPM data with at least two decimal places.
Can you help me to modify the original program?
I’ll apreciate your help.
Thanks.
Carlo Alberto
Hello Alberto,
All the code is here: https://github.com/jamesfowkes/fMainsDisplay
It uses my AVR code library, here: https://github.com/jamesfowkes/Code-Library/tree/master/AVR
In application.h line 5 has a #define IDEAL_F_MAINS (50U). Change this to 30 and you’ll be off to a good start.
Using the PDF of the schematic, you’ll need to replace the mains input with your IR sensor.
Hope that helps,
James
Hi James,
thanks for replay.
I see you’ve made a wonderful pcb.
You still have a few pieces to sell me?
Thanks.
Alberto.
Hi,
I don’t have any of these PCBs available right away, but I can make one if you like.
The cost would be £20 built with all components.
Will you want the display PCBs as well? I will have to calculate the cost of those.
Hi James,
great!
I’m interested about complete circuit, so even with the display.
Additionally, if you’re so kind to modify the software setting to 30Hz, even better, since I do not have the programmer for Atmel…
Let me know the total amount (to Italy)…
Thanks.
What I really need to measure is the RPM of my turntable that has a rated speed of 33,333 RPM.
With my sensor that detects 54 pulse at each turn, the signal frequency is 30 Hz.
RPM = 60 / (N * T).
Where: N = number of pulses per revolution
T = period = 1 / f
In my case: RPM = 60 / (54 * T)
Would it be easier for you to buy a normal tachometer?
I’m happy to build another display, but I haven’t done any reliability or accuracy testing. It won’t be production quality either. And because it’s a one-off item, it’ll be expensive (I think it will be about £80 with time and materials)
the most tachometers that can be found have a resolution of 1 Hz (0 decimal), which for my purpose is not enough.
Your frequency counter instead has a resolution of 3 decimals at 50 Hz. Since the frequency of my signal is very similar (30 Hz), this project is almost perfect.
It is sufficient to modify the code to calculate the RPM value (formula described above) instead of the frequency, starting from the same data (period and number of pulses)
Also, looking the excellent work you have accomplished, I trust your work.
If you want to build it, the cost is not a problem, for me is fine.
If you agree I’ll send you the payment via Paypal before you proceed..
Let me know.
Thanks.
Hello,
Your high-accuracy frequency meter is interesting for my work. I am designing controllers for primary frequency control in power systems, and I need high accuracy meters (~1mHz).
Can you please provide me with a cost estimate of the meter?
Best regards,
Eavngelos
I don’t think this DIY meter is really appropriate for control systems, but if you email jamesfowkes@gmail.com I’d be happy to discuss in more detail.
Pingback: Spinning AC mains frequency display | Richard Mudhar